What Is Market Cap in Crypto?
On this page
What Is Market Cap in Crypto?
Market cap in crypto is the total value of a coin's circulating supply: its current price multiplied by the number of coins in circulation. It is the standard way to compare the size of different cryptocurrencies, and it explains why a coin priced at $0.10 can be worth more overall than one priced at $100.
In this guide, you will learn exactly how crypto market cap is calculated, why it matters for risk and returns, and how to avoid common traps like thin float manipulation or misleading fully diluted numbers. If you are brand new to crypto, start with our friendly primer, Crypto for Beginners, then come back here to level up your valuation skills.
By the end, you will know when market cap is useful, when it is not, and how to use it alongside volume, liquidity, and supply schedules to make smarter decisions.
Why Market Cap Matters In Crypto
Market capitalization is the total market value of a cryptocurrency's circulating supply. It lets you compare assets on an apples-to-apples basis, instead of getting distracted by low or high unit prices. A token's price can be $0.002 or $2,000, but its market cap tells you how much value the market assigns to the network today.
For context, Bitcoin launched in 2009 and grew to a multi-hundred-billion-dollar market cap by 2021. Ethereum, which introduced programmable smart contracts in 2015, also climbed into the hundreds of billions. Both are built on blockchain principles, yet their market caps reflect different adoption curves, utility, and perceived risk. In bear markets, caps contract as risk appetite falls. In bull markets, risk tolerance expands and capital flows down the risk curve to smaller caps. If you want to understand cycles, read our guide to crypto volatility alongside this article.
Market cap tiers help investors quickly gauge typical risk profiles:
- Large cap - generally above $10 billion. These tend to be more liquid, widely held, and less volatile.
- Mid cap - typically $1 billion to $10 billion. More upside potential, but higher downside risk.
- Small cap - usually below $1 billion. Illiquidity is common, with sharper moves in both directions.
These thresholds are conventions, not laws. The point is that lower-cap assets can move faster, but they are also more fragile during drawdowns.
How Crypto Market Cap Is Calculated
The core formula is simple: Market Cap = Price x Circulating Supply. The tricky part is defining circulating supply correctly for crypto.
Circulating supply excludes tokens that are provably locked, burned, or reserved. It includes coins already issued and freely tradable on the market. For Bitcoin, issuance follows a predictable schedule with a hard cap of 21,000,000 coins. For Ethereum post-2022, issuance and burns interact with network demand, so net supply can trend down or up depending on activity and fees.
Supply depends on a project's design:
- In Proof of Work systems like Bitcoin, new coins are minted as block rewards to miners until the cap is reached.
- In Proof of Stake systems, validators receive staking rewards. Staking does not remove coins from circulation by itself, but if tokens are locked during staking, circulating definitions may vary across data providers.
- What Are Stablecoins? typically expand and contract supply based on demand or collateral.
A quick example:
- Asset A trades at $50 with 1,000,000 tokens circulating. Market cap = $50,000,000.
- Asset B trades at $0.05 with 1,000,000,000 tokens circulating. Market cap = $50,000,000.
Different unit prices, same market cap. This is why unit price alone is a poor way to judge value.
Beyond Headline Market Cap: FDV, Free Float, And "Real" Market Cap
Headline market cap uses circulating supply. Fully Diluted Valuation, or FDV, uses max supply: FDV = Price x Max Supply. FDV tells you what the project would be worth if all tokens existed today. It can be insightful for long term dilution risk, but it can also be misleading when large unlocks are years away.
Consider vesting schedules. If a project has 1,000,000,000 max tokens but only 100,000,000 circulating today, FDV might look huge compared to the current market cap. The key question is when and how the remaining 900,000,000 will enter circulation. If major unlocks happen in 6 to 12 months, short term selling pressure can be significant.
Some analysts track a "free float" market cap, which narrows circulating supply to tokens that are not only minted but also likely to trade freely. Heavily vested, team-controlled, or treasury tokens may be technically circulating but not realistically available. There is no universal standard here, so you must study token distribution, vesting cliffs, and on-chain wallet labels to approximate free float.
In decentralized finance, total value locked (TVL) adds another lens. TVL measures capital deposited in protocols. It is not the same as market cap, but in DeFi it can contextualize whether a token's valuation aligns with the value actually used in smart contracts. See our guide on What is DeFi? and always DYOR when token unlocks or treasury ownership look concentrated.
Market Cap vs Price, Volume, And Liquidity
Market cap is a snapshot, not a trading instruction. Price, volume, and liquidity tell you how that snapshot behaves in real time.
- Price reflects the last traded level. It can move on thin volume.
- Volume shows how much was traded over a period. Higher volume often means tighter bid-ask spreads and more reliable prices.
- Liquidity is how much you can buy or sell without moving the price. A $500 million cap token with shallow order books can slip 5 percent or more on a moderate market order.
Understanding liquidity is crucial for entries and exits. On centralized venues, order book depth shows how much size is available near the current price. On-chain, automated market makers rely on pool depth and pricing curves. Our primer on Understanding Crypto Exchanges explains order books versus AMMs so you can match your strategy to the venue.
Finally, do not assume a low price means "cheap" or a high price means "expensive". Market cap, free float, and liquidity together paint a more accurate picture.
How Market Cap Changes Over Time
Market cap moves with both price and circulating supply. Price reacts to demand, narratives, and macro conditions. Supply changes with emissions, burns, and unlocks.
- Bitcoin's supply schedule halves approximately every 210,000 blocks, historically every 4 years. The most recent Bitcoin Halving events occurred in 2012, 2016, 2020, and 2024. Halvings cut new issuance by 50 percent, which can change the flow balance over time.
- Ethereum's post-Merge dynamics include issuance to validators and burns linked to network activity. When on-chain demand is high, net issuance can turn negative.
- Many proof of stake projects pay staking rewards, growing supply. Read our Crypto Staking guide to understand how staking impacts emissions and lockups.
- Projects with aggressive token unlocks often see supply expand rapidly. If demand does not keep up, market cap can stall or fall even if the unit price looks stable.
A simple rule of thumb: if net new supply is large and persistent, upside requires equally strong or stronger demand. Always check issuance schedules and vesting calendars.
Red Flags: When Market Cap Misleads
Market cap is elegant in theory but messy in practice when free float is tiny or data is low quality. Two common pitfalls illustrate why you should look deeper.
Case study 1 - Thin float illusion: A new token mints 1,000,000,000 units but lists only 100,000 on exchanges. Early trades print at $10. Headline market cap might show $10,000,000 based on 1,000,000 circulating at launch, but FDV screams $10,000,000,000. The real capture is that only a sliver of supply is tradable. As more tokens unlock, price can compress sharply.
Case study 2 - Wash trading and spoof liquidity: An exchange shows huge volume with tight spreads, but on-chain data and cross-venue prices do not confirm it. If you buy size, you push the market far more than expected. Beware venues or pairs with inconsistent quotes and sudden gaps.
Other warning signs to investigate:
- Concentrated ownership - team or treasury controls a high percentage with weak vesting transparency.
- Unrealistic FDV - price extrapolated across a massive future supply with near-term unlocks.
- Synthetic scarcity - claimed burns or locks without verifiable on-chain proofs.
- Orphaned listings - token listed but with no real liquidity on reputable venues.
If something looks too smooth, read our primer on Crypto Scams and, if DeFi is involved, assess counterparty and smart contract risk before allocating.
Practical Ways To Use Market Cap In Your Research
Use market cap as a starting point to frame risk and opportunity, then layer on fundamentals and market structure.
Start with tiers. If you want steadier exposure, large caps will usually fit better than small caps. If you are seeking higher beta and can tolerate drawdowns, mid and small caps may be appropriate in a bull trend.
Then layer supply dynamics. Does issuance outpace demand, or are burns offsetting emissions? Are there big vesting cliffs in the next 3 to 6 months? Could staking lock up enough supply to reduce float during a narrative window, or are rewards creating sell pressure?
Finally, ground your plan in liquidity. If you would struggle to exit on a -20 percent day without heavy slippage, size your position accordingly. Build a written checklist that includes cap tier, free float, unlocks, liquidity, and fundamentals. And track progress over time with a simple spreadsheet or a portfolio tool like our guide on How to Track Your Crypto Portfolio.
Where To Check Market Caps Safely
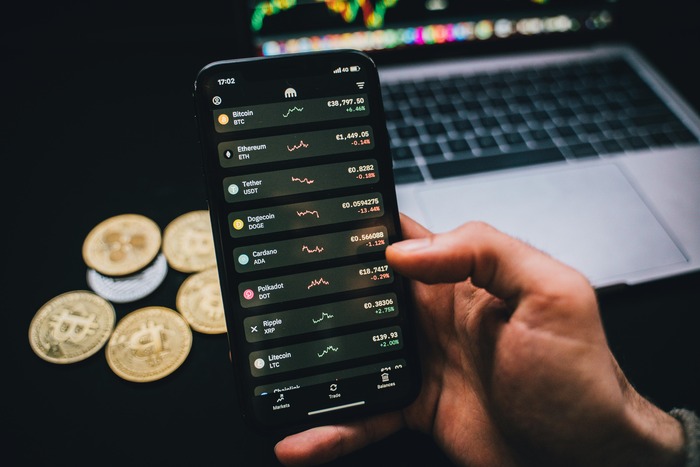
You can view reliable market cap data on leading exchanges and data dashboards. For trading or price discovery, many beginners start with Coinbase or Binance for breadth and liquidity, and Kraken for strong fiat rails and security history.
When cross-checking numbers, compare at least two sources and spot inconsistencies. Confirm whether a "circulating supply" figure aligns with the project's token contract and vesting disclosures. If the numbers do not reconcile, dig deeper before you trade. As you learn the plumbing of different venues, our overview of Understanding Crypto Exchanges can help you know what to expect from centralized order books versus automated market makers.
FAQs: Quick Answers To Common Questions
- What is a good market cap for a coin? There is no universal "good" cap. Large caps above $10 billion tend to be more liquid and less volatile, but your choice depends on risk tolerance and strategy.
- Can a coin with a low price have a huge market cap? Yes. Unit price is irrelevant without supply. Price x supply determines market cap.
- Is FDV more important than market cap? They answer different questions. Market cap is today's valuation. FDV is tomorrow's potential valuation if all tokens circulate. You need both, plus timing for unlocks.
- Why did a token's market cap jump overnight? Often due to supply events or reclassification of circulating tokens. Check contracts, updates, and on-chain announcements.
Conclusion: Use Market Cap As A Starting Line, Not The Finish
Market cap is the cleanest way to compare the scale of crypto assets, but it is not a substitute for research. It tells you how the market prices circulating tokens right now, not how price or supply will evolve. When you combine it with free float analysis, vesting schedules, liquidity depth, and realistic demand drivers, your decisions become significantly more resilient.
If you are new, begin by mapping the cap tiers that fit your risk tolerance, then study supply schedules for the few assets you own. Our guides to What is Bitcoin? and What is Ethereum? will help you understand two of the largest caps, and when you want to go deeper on issuance and consensus design, see Proof of Work and Proof of Stake. With a clear process and patient sizing, you can use market cap to navigate the noise and build confidence over time.
*Disclaimer: The information provided here is for informational purposes only and does not constitute financial advice. Cryptocurrency trading involves risks, so please DYOR. For beginners, check out our Beginners Guides to learn more.